Incident Investigation
Windows Security Event Logs Explained
Windows Security Event Logs Level: Intermediate
13 min read


Level: Intermediate
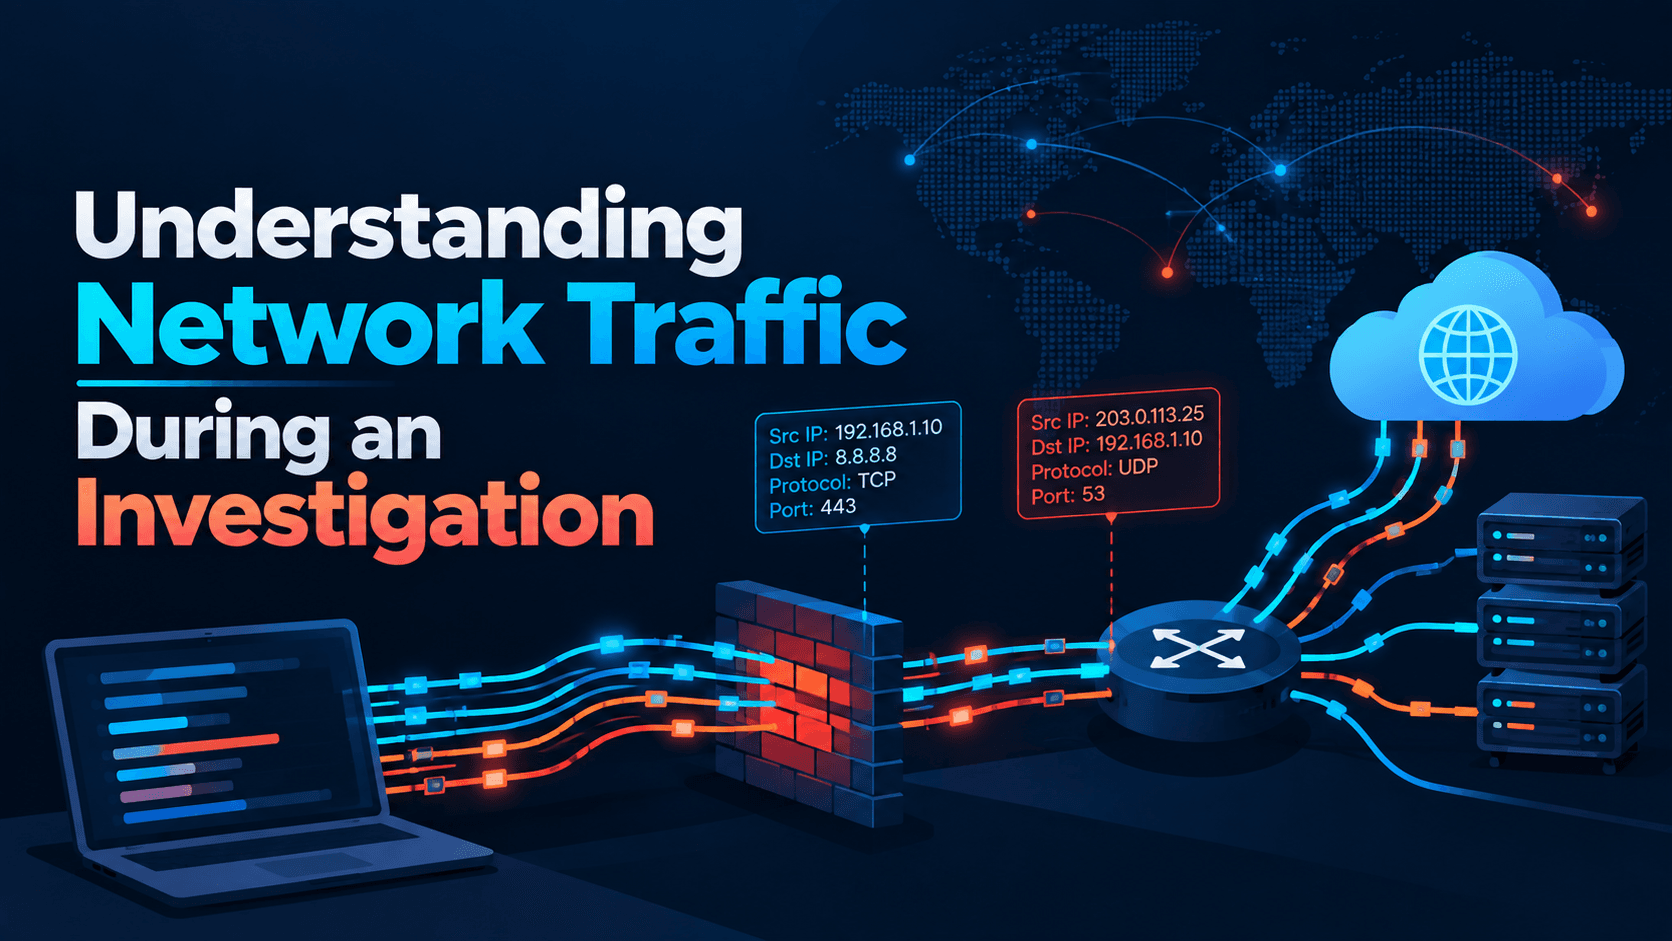
A suspicious process may tell you what happened on a device, but network traffic can help answer:
Where did the connection go?
Which system initiated it?
What protocol was used?
What data was exchanged?
Was the destination expected?
Did the system communicate with suspicious infrastructure?
Was there evidence of command-and-control or data exfiltration?
Understanding network traffic is therefore an important skill for SOC analysts, incident responders, and threat hunters.
Network traffic is the exchange of data between systems over a network.
For example:
User Device ↓ DNS Query ↓ IP Address ↓ TCP Connection ↓ Server ↓ Application DataDuring an investigation, analysts examine this communication to determine whether it represents normal business activity or potentially malicious behavior.
Consider a situation where an EDR alert reports that:
powershell.exeexecuted on a workstation.
The process itself is important, but it does not automatically mean the system is compromised.
Network telemetry can provide additional context.
For example:
PowerShell ↓ DNS Query ↓ New Domain ↓ External IP ↓ Outbound ConnectionIf the destination is known malicious infrastructure, the investigation becomes much more significant.
This is why endpoint and network evidence should often be correlated.
A practical investigation can follow this sequence:
Identify Host → Identify Connection → Analyze Destination → Analyze Protocol → Review Timeline → Correlate With Endpoint Activity → Determine Impact
Let's break this down.
Start by determining which system generated the suspicious traffic.
Collect information such as:
Hostname
IP address
Username
Device type
Operating system
Business function
Asset criticality
For example:
Hostname: FIN-LAPTOP-021 User: user123 IP: 10.10.25.18 OS: WindowsKnowing the asset's role helps establish whether the traffic is expected.
A database server communicating with another internal database server may be normal.
The same database server suddenly communicating with an unknown external IP may require investigation.
Next, determine:
Source IP
Destination IP
Source port
Destination port
Protocol
Timestamp
Connection direction
A basic connection can be represented as:
Source 10.10.25.18:51542 ↓ Destination 185.x.x.x:443This tells you that the internal system established an outbound connection to a remote system over TCP port 443.
However, port 443 alone does not prove that the traffic is legitimate HTTPS.
The application and destination still need to be investigated.
Direction is important.
Traffic entering your environment.
Internet → OrganizationPotential concerns include:
Scanning
Exploitation
Brute force
Web attacks
Unauthorized access attempts
Traffic leaving your environment.
Organization → InternetPotential concerns include:
Command-and-control
Data exfiltration
Malware communication
Unauthorized cloud storage
Cryptomining
Traffic between systems inside the organization.
Endpoint A → Endpoint BThis can be important for identifying:
Lateral movement
Remote administration
Credential attacks
Internal scanning
A destination IP or domain is one of the most valuable investigation points.
Ask:
Is it owned by a trusted organization?
Is it part of a known cloud provider?
Has the organization communicated with it before?
Is the domain newly observed?
Is the IP associated with malicious activity?
Does the domain resolve to multiple IPs?
Is the infrastructure shared with other suspicious domains?
Threat intelligence can help answer these questions.
However:
A poor reputation score alone does not prove compromise.
The analyst should correlate reputation with the actual behavior observed in the environment.
DNS is often one of the earliest clues during an investigation.
A device may first perform:
Client ↓ DNS Query ↓ example-domain.com ↓ DNS Response ↓ 203.0.113.10Investigate:
Domain queried
Query time
Response IP
Query frequency
DNS record type
First-seen information
Historical activity
Potential indicators include:
Newly observed domains
Random-looking subdomains
Very long domain names
High-frequency queries
Repeated queries to one unusual domain
Large numbers of TXT queries
DNS queries from systems that normally do not perform them
DNS should be investigated as part of the broader connection story rather than treated as malicious by itself.
Ports provide clues about the service involved.
Port Common Protocol/Service 22 SSH25 SMTP53 DNS80 HTTP443 HTTPS445 SMB3389 RDP389 LDAP636 LDAPS1433 Microsoft SQL Server3306 MySQLBut remember:
Port ≠ Protocol guarantee.
Attackers can use non-standard ports, and legitimate applications can operate on unusual ports.
Therefore, analysts should examine the actual application behavior where telemetry allows.
Understanding the basic difference between TCP and UDP helps during network investigations.
TCP is connection-oriented.
A simplified TCP connection begins with:
Client → SYN Server → SYN-ACK Client → ACKTCP is commonly used by services such as:
HTTPS
SSH
SMB
RDP
UDP is connectionless and does not use the same TCP handshake.
It is commonly used for:
DNS
DHCP
Streaming
Certain VPN technologies
Some attack techniques also abuse UDP because of its characteristics.
The number and timing of connections can reveal suspicious behavior.
For example:
10:01 → Connection 10:02 → Connection 10:03 → Connection 10:04 → Connection ...A system repeatedly contacting the same external destination at regular intervals may warrant investigation.
This can sometimes be consistent with beaconing, where malware periodically communicates with command-and-control infrastructure.
However, legitimate applications can also generate periodic traffic.
Therefore, investigate:
Destination
Process
User
Frequency
Payload characteristics
Historical baseline
C2 beaconing can appear as repeated connections between an infected system and an external destination.
A simplified example:
Endpoint ↓ C2 Server ↑ Every 60 secondsPotential characteristics include:
Regular intervals
Repeated destination
Similar connection size
Consistent protocol
Activity continuing for long periods
Threat hunters can search for systems that repeatedly contact unusual destinations at relatively consistent intervals.
Again, periodic traffic is not automatically malicious.
Monitoring software, update services, cloud applications, and other legitimate systems can also communicate periodically.
Network flow data provides metadata about communications.
Depending on the technology, flow records may include:
Source IP
Destination IP
Source port
Destination port
Protocol
Start time
End time
Bytes sent
Bytes received
Packet counts
A flow might look like:
Source: 10.10.20.15 Destination: 198.x.x.x Protocol: TCP Destination Port: 443 Bytes Sent: 25 MB Bytes Received: 2 KB Duration: 15 minutesThe large outbound-to-inbound ratio may be worth investigating, especially if the destination is unusual.
Network traffic can provide important evidence when investigating suspected data theft.
Look for:
Large outbound transfers
Unusual destinations
New external services
Transfers outside normal working hours
Unusual protocols
Large uploads to cloud storage
Repeated transfers over time
A simplified pattern might be:
Sensitive Files Accessed ↓ Archive Created ↓ External Connection ↓ Large Outbound TransferThe network activity alone does not prove exfiltration.
The analyst should correlate it with endpoint and user activity.
Network investigation is not limited to internet traffic.
Internal communication can reveal lateral movement.
For example:
Workstation A ↓ SMB ↓ Server BThen:
Server B ↓ RDP ↓ Server CIf the sequence is unexpected, it may warrant investigation.
Useful areas include:
SMB
RDP
WinRM
SSH
LDAP
Kerberos
Remote administration protocols
A compromised endpoint may attempt to discover and access other systems.
Possible indicators include:
Connections to many internal hosts
Scanning multiple ports
SMB connections to unusual systems
RDP connections from non-administrative workstations
Remote management activity
Authentication activity across multiple hosts
For example:
Compromised Endpoint ↓ Internal Scanning ↓ Host Discovery ↓ Credential Use ↓ Remote Service ↓ Second HostNetwork telemetry can help identify this progression.
When an IP appears in an alert, do not immediately conclude that it is malicious.
A structured investigation can include:
Check available threat-intelligence sources.
Determine whether the IP belongs to:
Cloud provider
CDN
Hosting provider
Organization
ISP
Residential network
Search whether other systems in your environment have communicated with the same IP.
Determine whether this is a one-time connection or repeated communication.
Check DNS information and known domain associations where available.
Determine which process initiated the connection.
This final step can be particularly valuable.
Suppose network telemetry shows:
10:15 Endpoint → Suspicious IP:443That alone may not tell you what caused the connection.
EDR telemetry may show:
10:15 powershell.exe → network connection → Suspicious IPNow the investigation becomes more interesting.
You can continue:
Email ↓ User clicked link ↓ PowerShell executed ↓ Network connection ↓ External destinationThis correlation can help establish an attack chain.
Consider another example:
09:10 — Failed authentication 09:12 — Successful login 09:15 — RDP connection 09:17 — SMB connection 09:25 — External connectionCombining authentication and network telemetry can reveal a possible sequence involving:
Credential compromise → Remote access → Lateral movement → External communication
This is far more useful than investigating each event independently.
PCAP (Packet Capture) contains captured network packets.
Unlike flow data, which generally provides metadata, a PCAP can provide much more detailed information about the communication.
Depending on encryption and available traffic, analysts may examine:
Source and destination
Protocol
Packet sequence
DNS requests
HTTP requests
TLS information
Network behavior
Payloads where visible
Tools such as Wireshark and tcpdump are commonly used for packet analysis.
A SOC may first identify suspicious traffic using flow or SIEM data and then move to PCAP when deeper analysis is required.
Modern applications commonly use encryption.
For example:
HTTPS TLS VPN SSHEncryption can prevent analysts from seeing the actual application content.
However, useful metadata may still be available, such as:
Source/destination
Timing
Connection frequency
Certificate information
TLS characteristics
Data volume
DNS activity
Therefore:
Encrypted does not mean invisible.
Traffic metadata can still provide valuable investigation clues.
Depending on the environment, analysts may use:
For detailed packet analysis.
For command-line packet capture and analysis.
For network security monitoring and protocol-level telemetry.
For IDS/IPS and network threat detection.
For network flow visibility.
For correlating network events with endpoint, identity, cloud, and application data.
For identifying which process or user generated network activity.
A timeline can help reconstruct an incident.
For example:
08:45 — User receives phishing email 08:52 — User visits suspicious domain 08:53 — DNS query observed 08:54 — PowerShell process starts 08:54 — External HTTPS connection established 08:56 — Additional domain contacted 09:02 — Credential authentication observed 09:10 — Internal SMB connections begin 09:20 — Large outbound transfer detectedThis provides a much clearer picture than individual alerts.
When investigating suspicious network traffic, ask:
Which user or system generated the traffic?
What communication occurred?
When did it happen?
What was the source and destination?
Is there a legitimate business explanation?
Which application, process, or protocol generated it?
Was the connection one-time or repeated?
How much data was transferred?
Did authentication, process execution, lateral movement, or data access occur afterward?
An IP reputation is one piece of evidence.
Attackers can use HTTPS and legitimate services can use unusual ports.
Internal traffic can reveal lateral movement.
DNS often provides valuable early indicators.
Knowing which process generated the connection can dramatically improve the investigation.
Legitimate applications can produce unusual-looking traffic.
An incident is usually a sequence of events rather than a single event.
Imagine an EDR alert reports suspicious PowerShell execution.
The analyst checks network telemetry and discovers:
PowerShell ↓ DNS Query ↓ new-domain.example ↓ 198.x.x.x:443The analyst discovers:
09:30 — Phishing email received 09:35 — User clicked link 09:36 — PowerShell executed 09:36 — DNS query 09:36 — HTTPS connection 09:40 — Additional C2-like connectionsThe analyst can now correlate:
Phishing → Execution → DNS → Network Communication
Further endpoint, identity, and threat-intelligence investigation can determine whether the activity represents a confirmed compromise.
When investigating suspicious traffic:
☐ Identify the affected host
☐ Identify the user
☐ Record source and destination IPs
☐ Identify ports and protocols
☐ Check DNS activity
☐ Investigate destination reputation
☐ Check historical communication
☐ Identify the initiating process
☐ Review connection frequency
☐ Analyze bytes sent and received
☐ Check for internal lateral movement
☐ Check for possible data exfiltration
☐ Correlate with authentication logs
☐ Correlate with endpoint telemetry
☐ Build an incident timeline
☐ Determine whether the activity is legitimate, suspicious, or malicious
Network traffic provides a different perspective from endpoint and authentication logs.
An endpoint may tell you:
"PowerShell executed."
Network telemetry may tell you:
"PowerShell connected to this external system."
DNS may tell you:
"The endpoint resolved this newly observed domain."
Authentication logs may tell you:
"The user account authenticated shortly afterward."
When these pieces are combined, they can reveal the broader attack story.
The most effective network investigations therefore follow a simple principle:
Don't investigate the connection alone. Investigate the user, host, process, destination, protocol, timing, volume, and surrounding activity.
A strong investigation connects:
Endpoint → DNS → Network → Identity → Cloud/Application → Threat Intelligence → Timeline
That correlation is what turns raw network traffic into meaningful evidence.
Continue reading
3 entries, most recent posts.
Category: Phishing / Artificial Intelligence

Severity: High CVSS: 8.7 Affected Products: Citrix NetScaler ADC & NetScaler Gateway Attack Type: Denial of Service / Possible Remote Code Execution

L1 Interview